Please Note: The gross merchandise value data presented below (“GMV”) is based on aggregate sales activity across our customer base selling on US-based sites and includes sales from all channels excluding digital marketing channels. This material also includes highlights concerning certain product categories. Because marketplaces have different category structures, the data is presented using categories that have been standardized by ChannelAdvisor. This GMV may not represent overall e-commerce activity or the performance of any individual business, including ChannelAdvisor or any individual marketplace.
Another Amazon Prime Day is in the books, and industry-wide fears of inflation and rising costs didn’t seem to scare away hordes of deal-seeking online consumers. The marketplace announced that over 300 million items were sold on Amazon during the two-day shopping holiday.
But Prime Day obviously extends well beyond Amazon, and Adobe Analytics estimated that total US e-commerce sales exceeded $11.9 billion and that the total number of e-commerce transactions rose 8.5% over last year’s two-day Prime Day period.
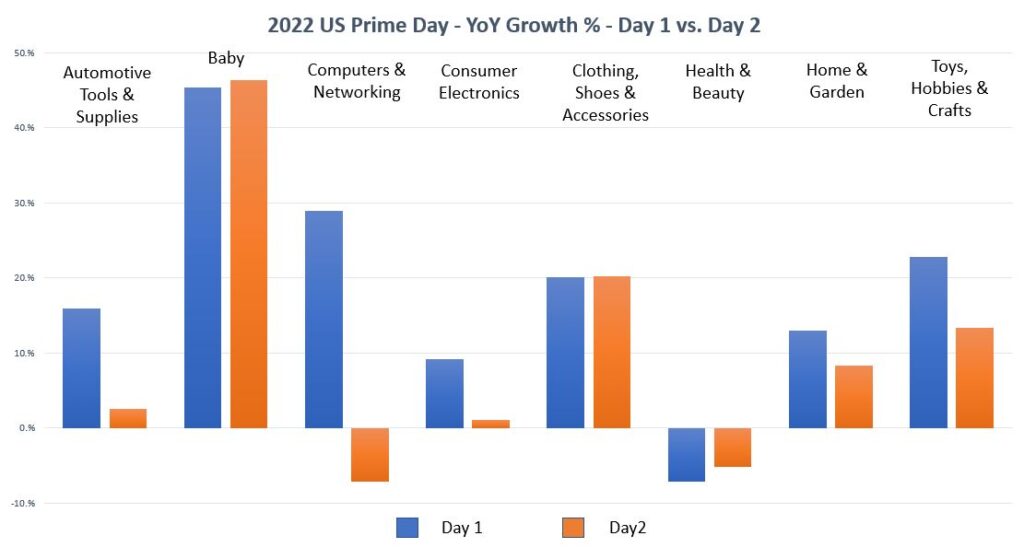
Yesterday, we used aggregate GMV data from ChannelAdvisor sellers across US marketplaces to highlight the relative performance of various categories following Day 1 of Prime Day. Below, we’ve updated this aggregate data from our platform — and added a few new categories — to compare both days of Prime Day. While the overall GMV results are relatively close to those of Day 1, there was a downward trend in many categories on the second day.

- Automotive Tools & Supplies — The Automotive category saw a dip on Day 2, according to our data, mostly at the expense of subcategories such as Hand Tools and Shop Equipment & Supplies, but the category’s combined YoY growth across the two-day period was nearly 10%.
- Baby — The Baby category is traditionally a large driver of marketplace GMV and our data indicated strong growth throughout Prime Day, powered by a variety of subcategories, from Car Safety Seats to Food Grinders & Blenders to Strollers & Accessories.
- Computers & Networking — As we noted yesterday, Computers & Networking saw strong YoY growth on Day 1. While there was a dropoff on Day 2, according to our metrics, the category still saw net positive growth across the holiday shopping period. Consumer Electronics behaved similarly to Computers, with a slight dip from Day 1 to Day 2, but ultimately finishing with net positive YoY growth in 2022.
- Clothing, Shoes & Accessories — The top-level category was pretty consistent in our platform between the two days, despite some minor fluctuations within many of the subcategories driven by various promotions.
- Health & Beauty — Based on ChannelAdvisor data, Health & Beauty’s growth percentage picked up a little ground on Day 2, which went against the trend we saw across most categories. Ultimately, this historically large category ultimately fell a little short of year-over-year positive growth rates.
- Home & Garden — Pretty consistent annual growth, per our data, although it was slightly down on Day 2. Home & Garden is a massive, wide-ranging category that covers everything from the Furniture, Home Decor and Tools subcategories to Yard, Garden & Outdoor Living.
- Toys, Hobbies and Crafts — Though our data tracked a Day 2 dip in growth, the healthy combined (Day 1 plus Day 2) year-over-year uptick was powered by a handful of subcategories, most notably Outdoor Toys; Electronic, Battery & Windup; and Art Supplies.
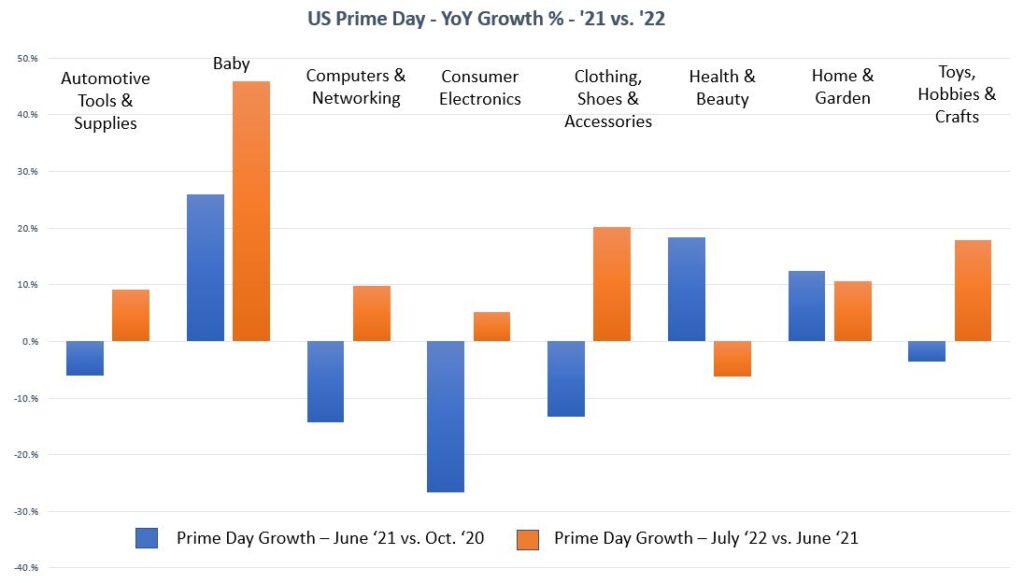
Just as we did in the last blog post, let’s zoom out and look at the year-over-year growth between Prime Day in 2021 and 2022 within those same categories.
In the chart below, we’ve combined the growth percentages of Day 1 and Day 2 for each year.*

The overall YoY growth trends in the categories we tracked remained consistent after combining the two shopping days, though the downward turn we saw across many categories on Day 2 narrowed the growth gap that they built on Day 1. Even with the weaker Day 2, however, most of the major categories — Computers & Network, Consumer Electronics, Home & Garden, Automotive, and others — were able to net solid YoY growth during Prime Day as a whole, according to our data.
An Economic Boost
We only tracked aggregate sales data from US marketplaces for the purpose of this post, but Amazon Prime Day 2022 was, by all accounts, a global success for both Amazon and thousands of sellers. Amazon claimed that this year was “the biggest Prime Day ever,” with consumers saving over $1.7 billion in deals worldwide. The event was a welcome bright spot amid global currency fluctuations and continued economic uncertainty.
Hopefully, the continued success of the annual shopping event foreshadows continued e-commerce growth as we approach the holiday shopping season.
We will continue tracking category trends periodically as we head into the holiday season, so be sure to subscribe to the blog to get the latest trends and strategies right to your inbox.
–
*As we mentioned in the previous post, it’s important to keep in mind that these year-over-year growth percentages were also affected by the month in which Prime Day was held each year. In 2020, Prime Day took place in mid-October, while in 2021, the holiday took place in June.


