Want to know what eCommerce conversion rate your store should be aiming beyond, or how it compares to your biggest competitors?
You’ve come to the right place!
Conversion rate benchmarks can be tricky as they differ depending on the industry or niche you’re selling in. This means that some brands should have higher or lower conversion rate goals than others, depending on the niches they are positioned in.
So how do you determine what your eCommerce conversion rate benchmark should be?
We’ve taken the guesswork out of it. By accumulating data from a wide variety of niches, we have collected the benchmark eCommerce conversion rates you should be aiming for in 2021.
Important Note About 2021 Conversion Rate Benchmarks
It’s normal for niche conversion rate benchmarks to fluctuate year-on-year. This can be influenced by several factors, including market competition and saturation, the types of target shoppers your products appeal to, and USP positioning within your niche, just to name a few.
Although these benchmarks give you an idea of what your store should be generating, there is a chance that fluctuations will occur depending on several factors, including:
- Overall customer experience
- Brand identity and product messaging
- Trustworthiness
- Technical performance
- Marketing strategy and platforms
- The devices shoppers are using
- Where target shoppers are located
Pro Tip: Before you compare industry conversion rates to your own brands, make sure you measure up to your closest competitors by the above factors. You can do this in minutes using this free eCommerce Benchmark tool.
So, What’s a Good Conversion Rate for Your Online Store?
In this post, we give you benchmark conversion rates for leading eCommerce niches and provide a comparison chart of all niches.
Ready to find out the average conversion rates for your niche?
Let’s dive in!
You can jump ahead to your specific niche by clicking the links below:
- Car Parts and Accessories
- Cosmetics
- Electronics and Computers
- Apparel and Accessories
- Gifts
- Health and Beauty
- Home and Garden
- Jewelry
- Pet Supplies
- Sports and Outdoor Goods
- Baby and Kids Toys and Accessories
- eCommerce Conversion Rates By Niche
Conversion Rate Benchmark for Car Part & Accessory Stores
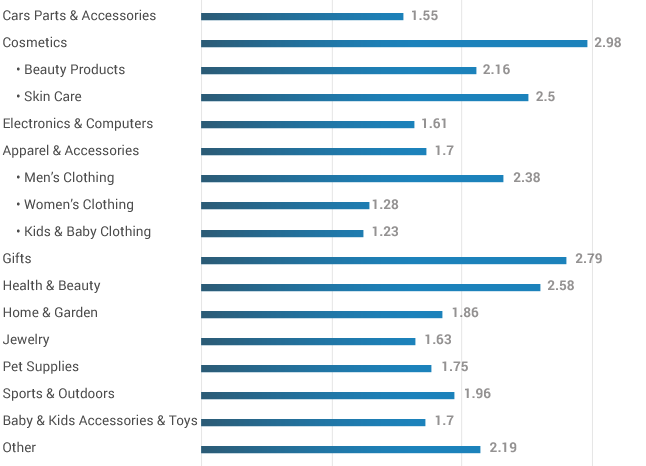
The current average conversion rate for car parts and accessories is 1.55.
Car parts may not seem like a ‘sexy’ niche. However, this online niche has grown extensively over the last couple of years. This growth is expected to continue at 3% per annum through to 2030. When you compare with other leading niche averages, such as women’s fashion which is only 1.28, its conversion opportunities are competitive.
Conversion Rate Benchmark for Cosmetics Stores
There is no doubt that the online cosmetics market is booming. In fact, it’s one of the few niches that experienced growth during COVID-19-related market changes. This niche also has the highest average conversion rates for eCommerce.
The current average conversion rate for a cosmetics store is a whopping 2.98. Other notable subcategories in terms of conversion rates are beauty products and skincare stores.
Conversion Rate Benchmark for Electronic and Computer Stores
The electronics industry growth rate is expected to reach 13% by 2023, with 35% of the products in this market being bought online. This is a highly saturated market, so you’ll have to work a little harder to convert shoppers in this niche.
Therefore, if you’re selling electronics or computers online, you should aim for a benchmark conversion rate of 1.61.
Conversion Rate Benchmark for Apparel and Accessories Stores
There is no doubt that online clothing stores are the most significant eCommerce niche. However, it is also one of the most competitive, which means, depending on your USP, you’re looking at an average conversion rate of 1.7. This is not as high as cosmetics, but as we know, the profit margins and earning potential are higher.
The conversion rate potential for men’s apparel and accessories stood out from our conversion rate benchmark data for this extensive niche.
Conversion Rate Benchmark for Gift Stores
If you’re selling in the global gift market, your average conversion rate benchmark is as high as 2.79. Considering that this market is set to reach $68 billion by 2024, you could take a substantial piece of the pie if your store, product, and marketing optimization is on point.
Conversion Rate Benchmark for Health and Beauty Stores
Another high-converting eCommerce niche is the online health and beauty industry. The current average conversion rate for a cosmetics store is a whopping 2.58.
Conversion Rate Benchmark for Home and Garden Stores
Another popular niche in 2020 was home and garden products, and the industry is growing. The average conversion rate benchmark home and garden eCommerce brands should aim for is 1.86, a few points higher than electronics.
Conversion Rate Benchmark for Jewelry Stores
The online jewelry market is growing at a CAGR of 15% annually, and is expected to grow by $19+ billion by 2024. With an expanding market comes saturation, making this niche conversion benchmark among the lowest for 2021.
Pro Tip: To capitalize on the growth despite lower conversion rate KPIs, you will need to use brand identity to scale your business. Here’s a summary from our How to Scale and Grow an Online Jewelry Business in 11 Steps post:
- Do a full store audit and then set goals
- Strengthen your jewelry brand identity
- Expand to new niches without alienating your core market
- Capitalize on seasonal and yearly trends
- Integrate buying and/or style guides
- Increase AOVs with sets and bundles
- Upgrade product photography
- Test “try-before-you-buy” incentives
- Invest in social media content beyond PPC
- Take on a social cause
- Invest in optimized digital campaigns for highly targeted traffic
Conversion Rate Benchmark for Pet Supply Stores
Another fast-growing niche is pet supply and accessory stores. Some 2021 trending products for the eCommerce pet industry include cat beds, dog pens, bowls, and collars.
Although the average conversion rate is below 2, this niche includes a lot of consumable products. Therefore, with a little marketing and product creativity, you could exceed conversion rate goals with a good retention rate.
Conversion Rate Benchmark for Sports and Outdoor Goods Stores
The average conversion rate benchmark you should be aiming for with your sports and outdoors eCommerce brands is 1.96. In May of last year, online shopping for sporting goods increased by 216%. Although competition increased, so did steady demand.
Conversion Rate Benchmark for Baby and Kids Toys and Accessories Stores
Next on our list of optimum conversion rates by niche for online stores is baby and kids toy and/or accessory stores.
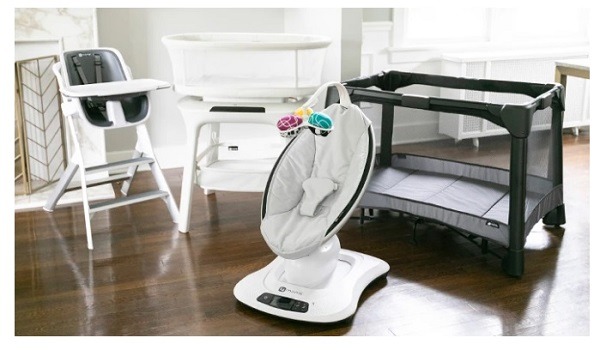
With an average conversion rate of 1.7, this niche is a little lower than other industries, but that doesn’t mean it doesn’t have huge potential. Here’s a baby tech product (from mamaRoo) we highlight in our Best-Selling Products to Sell Online in 2021 post that shows the trend and innovation potential around this niche.

eCommerce Conversion Rates By Niche
Now that we’ve looked at the average conversion rates you should be aiming for, here’s a complete breakdown comparison of each conversion rate benchmark.

—
Setting conversion rate KPIs and optimizing your shopping experience and marketing to reach these goals is just as important as optimizing and managing your online marketing strategy. No matter what industry you are in, there are always ways to improve your brand’s conversion rates.
Here are 20 Ways You Can Improve Conversion Rates Today to get you started.
If you are a top retailer or eCommerce marketer looking to optimize your brand’s traffic streams to peak conversion rate performance, take a look at our Traffic Booster Enterprise.

Nicole Blanckenberg
Nicole is a content writer at StoreYa with over sixteen years experience and flair for storytelling. She runs on a healthy dose of caffeine and enthusiasm. When she’s not researching the next content trend or creating informative small business content, she’s an avid beachgoer, coffee shop junkie and hangs out on LinkedIn.
Comments
comments
Powered by Facebook Comments


