Please Note: The gross merchandise value data presented below (“GMV”) is based on aggregate sales activity through our platform on marketplaces across our entire customer base globally. The growth percentages are based on “same store sales” (i.e., only accounts generating sales in both time periods were factored into the calculations) during the week of Thanksgiving. This material includes highlights concerning certain product categories. Because marketplaces have different category structures, the data is presented using categories that have been standardized by ChannelAdvisor. These metrics may not represent overall e-commerce activity or the performance of any individual business, including ChannelAdvisor or any individual marketplace. Unless otherwise noted, all calculations are done in USD and are not normalized to account for fluctuating exchange rates.
—
Another Black Friday is officially in the books as the holiday shopping season continues to unfold.
We wondered last week whether global supply chain concerns had motivated shoppers to shop earlier and “pull forward” GMV earlier in the holiday season. While there are still plenty of shopping days left to come, there is some evidence, based on last week’s sales growth, that this shift did occur at least in some categories.
As usual, the volume of sales during “Thanksgiving Week” (Sunday, November 21 through Saturday, November 27) was much higher than the weeks leading up to it. But while year-over-year sales growth was firmly positive during this week, most categories actually experienced higher year-over-year growth rates during the first half of Q4 (October 1 through November 20) than they did during Thanksgiving Week, indicating that shoppers have indeed thus far “pulled forward” some of their holiday spending. It’ll be super interesting to see if there’s a second wave of growth as all the procrastinators out there start to panic!
In our last post, we highlighted the “same store sales” GMV growth by category for all Q4 GMV leading up to the week of Thanksgiving. We noted that with pandemic restrictions loosening in 2021 and extremely strong growth in 2020, any growth in 2021 on top of the impressive 2020 growth (which included Prime Day in October) suggests that the acceleration in e-commerce adoption from 2020 has, thus far, stuck.
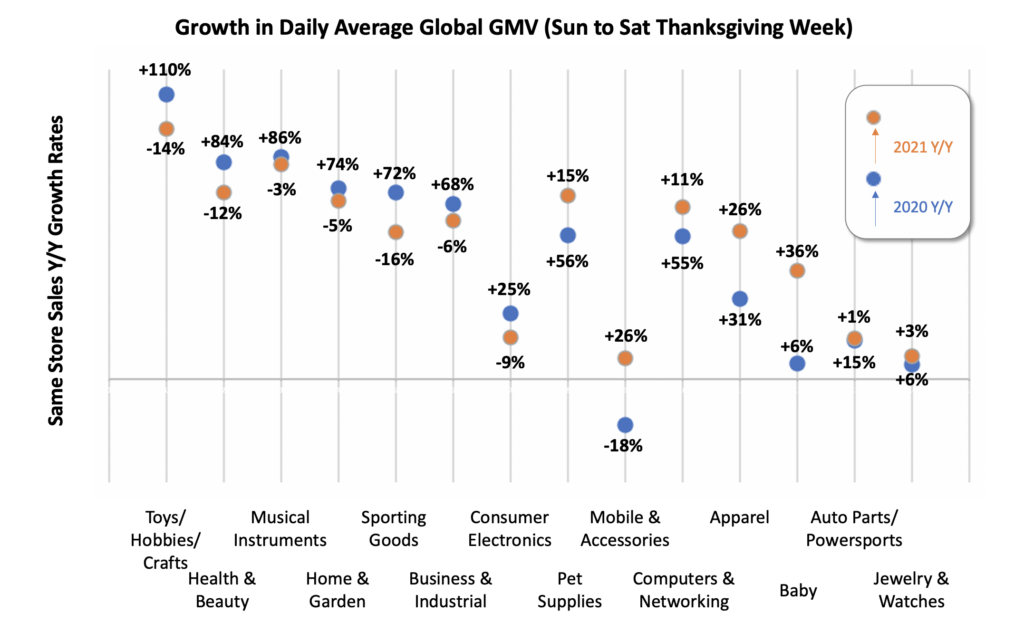
The chart below highlights the year-over-year category GMV growth rates during Thanksgiving Week in both 2020 and 2021. Because we are using the “same store sales” methodology, these numbers are independent of any changes in ChannelAdvisor’s customer base.
Top growth categories for Thanksgiving Week 2021 included baby gear (+36%), mobile and accessories (+26%), apparel (+26%), pet supplies (+15%), and computers and networking (+11%). Of course, this represents only one week of data and may say more about the timing of promotional activity and the impact of supply chain fears than overall category performance.


