Please Note: The gross merchandise value data presented below (“GMV”) is based on aggregate sales activity across our customer base selling on US-based sites and includes sales from all channels excluding digital marketing channels. This material also includes highlights concerning certain product categories. Because marketplaces have different category structures, the data is presented using categories standardized by ChannelAdvisor. This GMV may not represent overall e-commerce activity or the performance of any individual business, including ChannelAdvisor or any individual marketplace.
Amazon Prime Day is here, and though inflation is on everyone’s mind and industry expectations are slightly muted compared to past years, the early results that ChannelAdvisor has tracked internally look promising.
Aggregate GMV from ChannelAdvisor sellers across US marketplaces on Day 1 of Prime Day saw relatively strong growth from 2021 to 2022. Overall, our data may indicate that consumers are still spending, even in non-essential, discretionary categories.
But which categories had the most interesting movement on Day 1, compared to last year, and which ones should we watch as we head into Day 2?
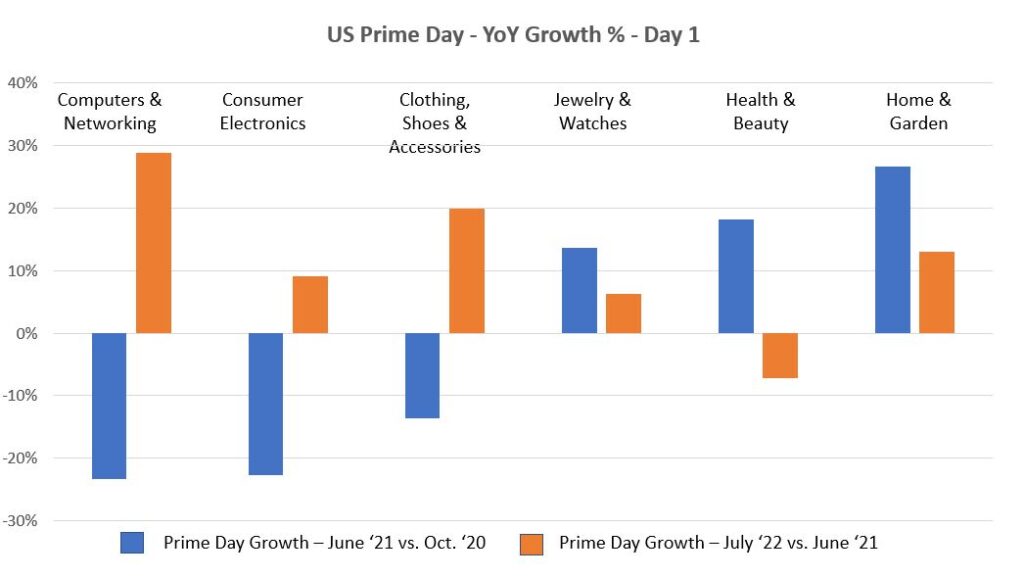
Keep in mind that these year-over-year growth percentages were also affected by the month in which Prime Day was held each year. In 2020, Prime Day took place in mid-October. Thus, the 2021 year-over-year Prime Day growth numbers are heavily influenced by seasonality. For example, Q4 typically sees stronger sales in consumer electronics categories, including cameras and computers; 2021 Prime Day growth in these categories looks weaker as a result. On the flip side, June is typically a stronger month for outdoor categories, which likely helped the 2021 Prime Day growth relative to 2020 in Home & Garden. 2022 Prime Day growth metrics don’t suffer from these differences in seasonality.

The year-over-year growth percentages between Prime Day in 2021 and 2022 (shown in orange in the graph) are a much easier and more natural comparison, since they fell within three weeks of one another on the calendar and the shopping seasonality matches up. Here are some categories we’re watching after Day 1:
- Computers & Networking / Consumer Electronics — Both of these categories came back strong in 2022 based on ChannelAdvisor’s data. Last year’s growth comparison was heavily impacted by 2020’s October Prime Day, which essentially served as the kickoff to the 2020 holiday shopping season.
- Clothing, Shoes and Accessories — The top-level clothing category saw solid year-over-year growth, according to our metrics, led by subcategories Kids’ Clothing, Shoes & Accessories; Men’s Shoes; and Women’s Shoes.
- Health & Beauty — Health & Beauty’s slight decrease on Day 1, per our data, could portend less discretionary consumer spending in certain categories as we move through 2022. The dip in several non-essential subcategories such as Massage and Vitamins & Dietary Supplements may support that theory.
- Home & Garden — Traditionally, Home and Garden is one of our biggest GMV categories. The growth on Day 1, according to our data, reflects that ongoing momentum, despite recent forecasts of tighter consumer spending within subcategories like Home Improvement and Furniture.
Look for our Prime Day wrap-up blog tomorrow as we analyze Day 2. And be sure to subscribe to the blog to get the latest e-commerce trends, tips and strategies in your inbox throughout the year.


