
Last Updated on January 18, 2021


People spend a ton of time on YouTube, which means more advertisers are attracted to the platform.
So if you’re spending money on YouTube Ads campaigns, or planning on doing so, it’s important to know how you’re doing.
The first measure of succes is to compare the results of on YouTube campaign to another. But besides your own data, it’s often helpful to compare your metrics to benchmarks of other advertisers.
That can help you to identify areas where you might be underperforming.
So in this article, I’ve compiled all the YouTube Ads benchmarks I could find!
Table of Contents
YouTube Ads Cost Per View (CPV)
The average YouTube Ads CPV is $0.026
Source: Strike Social benchmark report 2018
The cost per view is calculated by dividing the overall cost by the number of views.
While that might sounds straightforward, I want to pay a little attention to the definition of a view:
On YouTube a view is counted when someone watches 30 seconds of your video ad ( or the duration if it’s shorter than 30 seconds) or interacts with the ad, whichever comes first.
And better: if there is no view, you don’t pay. So if someone watches the first 5 seconds of your ad but then skips, you don’t pay.
Why is this metric important?
The average cost per view is a lagging metric of the performance of your ads.
If your CPV is higher compared to the benchmark, it’s time to dig a little deeper and look at your creative, targeting, or both!
Cost per view by age group
Here is a breakdown of the YouTube Ads cost per view by age group:
| Age | Cost per view |
| 18-24 | $0.025 |
| 25-34 | $0.029 |
| 35-44 | $0.028 |
| 45-54 | $0.029 |
| 55-64 | $0.025 |
| 65+ | $0.024 |
| Unknown | $0.020 |
Source: Strike Social benchmark report 2018
Cost per view by gender
Here is a breakdown of the YouTube Ads cost per view by gender:
| Gender | Cost per view |
| Female | $0.028 |
| Male | $0.026 |
| Unknown | $0.023 |
Source: Strike Social benchmark report 2018
Cost per view by month
Here is a breakdown of the YouTube Ads cost per view by month:
| Month | Cost per view |
| January | $0.026 |
| February | $0.030 |
| March | $0.030 |
| April | $0.022 |
| May | $0.025 |
| June | $0.028 |
| July | $0.024 |
| August | $0.022 |
| September | $0.026 |
| October | $0.028 |
| November | $0.033 |
| December | $0.045 |
Source: Strike Social benchmark report 2018
It goes up and down during the year, but the most interesting part of this table is the benchmark for December.
It’s peak shopping season, which attracts more advertisers to the platform, which drives up CPV.
Cost per view by device
Here is a breakdown of the YouTube Ads cost per view by device:
| Device | Cost per view |
| Desktop | $0.028 |
| Phone | $0.026 |
| Tablet | $0.025 |
Source: Strike Social benchmark report 2018
Cost per view by Industry
Here is a breakdown of the YouTube Ads cost per view by device:
| Industry | Cost per view |
| Education | $0.037 |
| Fashion | $0.046 |
| Telecommunications | $0.048 |
| Baby & Child Care (CPG) | $0.035 |
| Healthcare & insurance | $0.071 |
| Toys | $0.038 |
| Household appliances | $0.047 |
| Entertainment | $0.035 |
| Restaurants | $0.037 |
| Government & advocacy | $0.040 |
| Health & beauty | $0.034 |
| Travel | $0.047 |
| B2B | $0.037 |
| Sports | $0.034 |
| Business & Finance | $0.048 |
| Science & technology | $0.038 |
| Automotive | $0.058 |
| Adult beverage | $0.06 |
| Food (CPG) | $0.043 |
| Electronics | $0.042 |
| Art | $0.057 |
| Home & Garden (CPG) | $0.088 |
| Gambling | $0.062 |
| Gaming | $0.046 |
| Retail | $0.045 |
Source: Strike Social 2017 benchmark report
The cost per view follows a similar trend to the CPC in Google Ads. If there is lots of money to be made, CPVs are higher.
YouTube Ads CPM
The average YouTube Ads CPM is $3.53.
Source: AdStage Q1 2020 benchmark report.
CPM is short of cost per mile, or 1000 impressions.
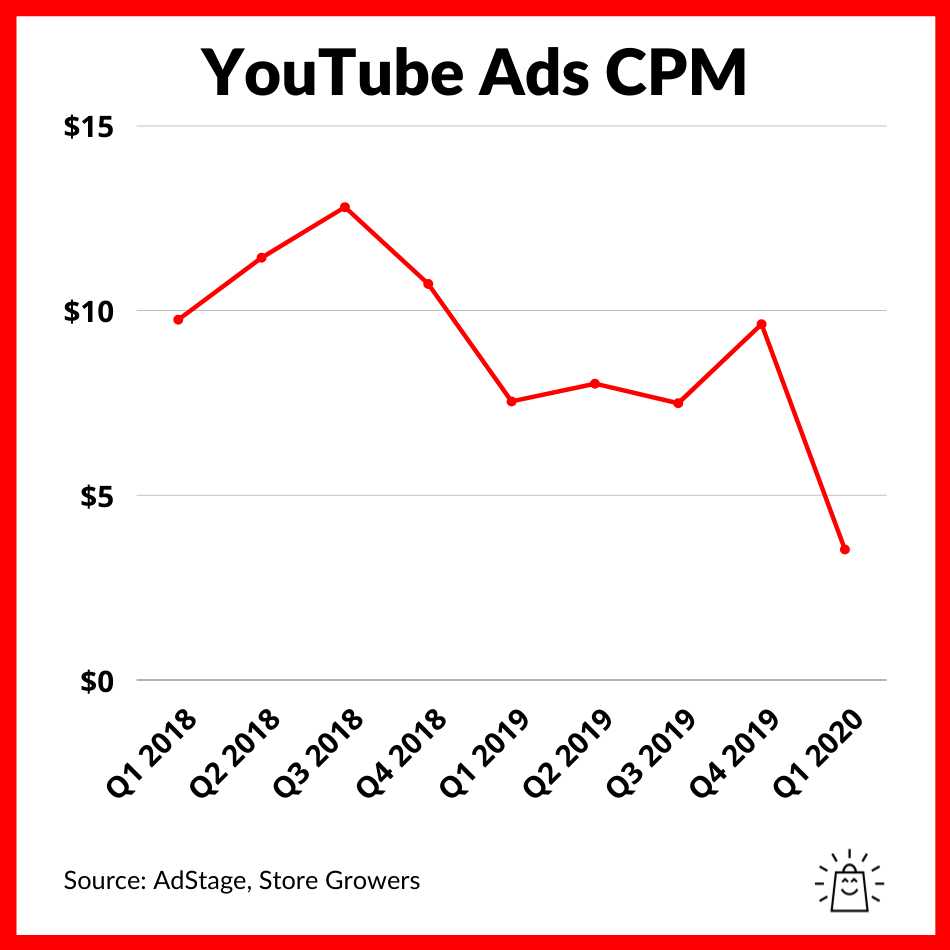

During the last couple of years, CPMs have gone up and down. But in Q1 of 2020, there was a big drop.
This is the COVID 19 effect. Lots of brands were unsure how the virus was going to play out, and many stopped spending all together.
As a result, buying ads became a lot cheaper.
YouTube Ads View rate
The average YouTube Ads view rate is 31.9%.
Source: Strike Social benchmark report 2018
This number is calculated by dividing the number of views by the total impressions.
Why is it important?
The average view rate tells you how relevant an ad is to a specific audience. I look at it as the quality score for YouTube Ads.
Your goal is not 100%, but to spot ads/ad groups where the view rate is far below the average.
View Rate By Age Group
Here is a breakdown of the YouTube Ads view rate by age group:
| Age | View rate |
| 18-24 | 31.5% |
| 25-34 | 29.6% |
| 35-44 | 31.4% |
| 45-54 | 32.3% |
| 55-64 | 34.7% |
| 65+ | 31.3% |
| Unknown | 37.4% |
Source: Strike Social benchmark report 2018
View Rate by Gender
Here is a breakdown of the YouTube Ads view rate by gender:
| Gender | View rate |
| Female | 28.1% |
| Male | 34.4% |
| Unknown | 37.7% |
Source: Strike Social benchmark report 2018
View Rate by Month
Here is a breakdown of the YouTube Ads view rate by month:
| Month | View rate |
| January | 34.2% |
| February | 29.2% |
| March | 30.1% |
| April | 38.5% |
| May | 37.5% |
| June | 36.4% |
| July | 26.6% |
| August | 31.6% |
| September | 37.3% |
| October | 25.1% |
| November | 18% |
| December | 10% |
Source: Strike Social benchmark report 2018
View Rate by Device
Here is a breakdown of the YouTube Ads view rate by device:
| Device | View rate |
| Desktop | 35.4% |
| Phone | 33.2% |
| Tablet | 26.2% |
Source: Strike Social benchmark report 2018
View Rate by Industry
Here is a breakdown of the YouTube Ads view rate by industry:
| Industry | View rate |
| Education | 35.4% |
| Fashion | 32% |
| Telecommunications | 31.9% |
| Baby & Child Care (CPG) | 31.2% |
| Healthcare & insurance | 31.2% |
| Toys | 31% |
| Household appliances | 30.7% |
| Entertainment | 30.2% |
| Restaurants | 29.7% |
| Government & advocacy | 29.6% |
| Health & beauty | 29.6% |
| Travel | 29.6% |
| B2B | 35.4% |
| Sports | 35.4% |
| Business & Finance | 35.4% |
| Science & technology | 35.4% |
| Automotive | 35.4% |
| Adult beverage | 35.4% |
| Food (CPG) | 35.4% |
| Electronics | 35.4% |
| Art | 35.4% |
| Home & Garden (CPG) | 35.4% |
| Gambling | 24.4% |
| Gaming | 24% |
| Retail | 15.7% |
Source: Strike Social 2017 benchmark report
YouTube Ads CPC
The average YouTube Ads CPC is $0.49.
Source: AdStage Q1 2020 benchmark report.
CPC is short for cost per click.
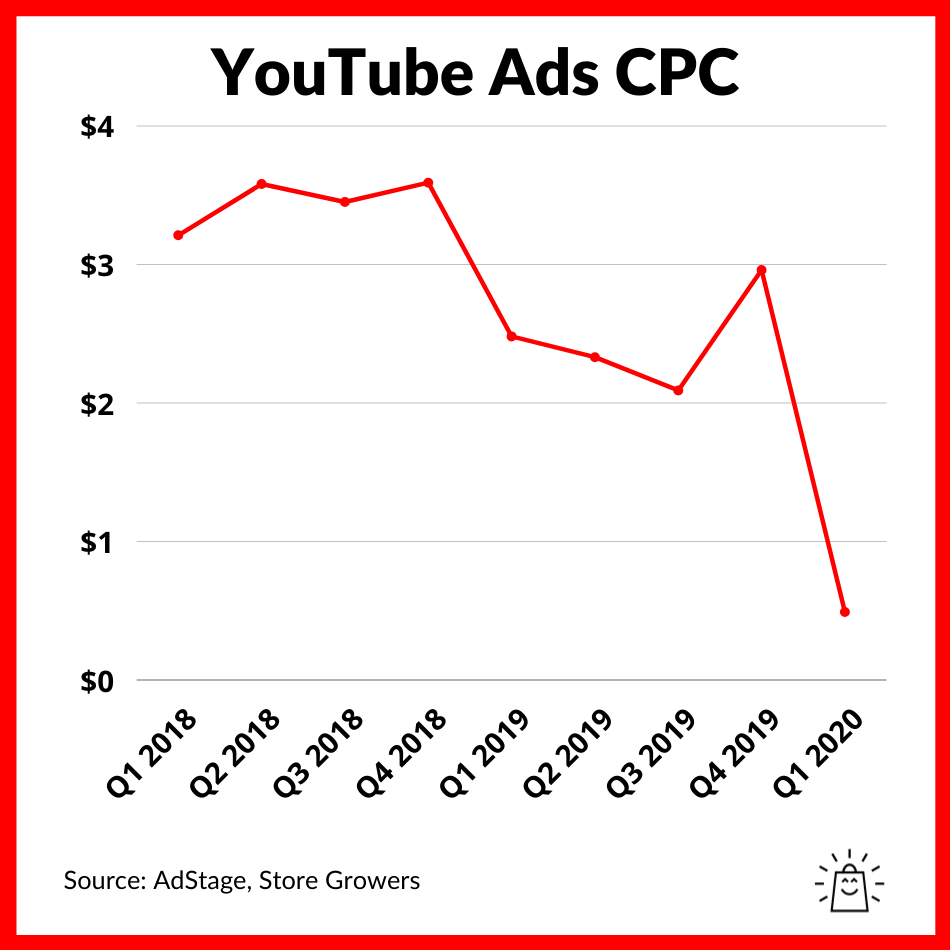

Similar to the sharp decline in CPV due to COVID 19, the CPC also plummeted during Q1 of 2020.
YouTube Ads CTR
The average YouTube Ads CTR is 0.65%.
Source: AdStage Q1 2020 benchmark report.
CTR is short for click through rate. It’s calculated by dividing the number of clicks on your ads by all the views.
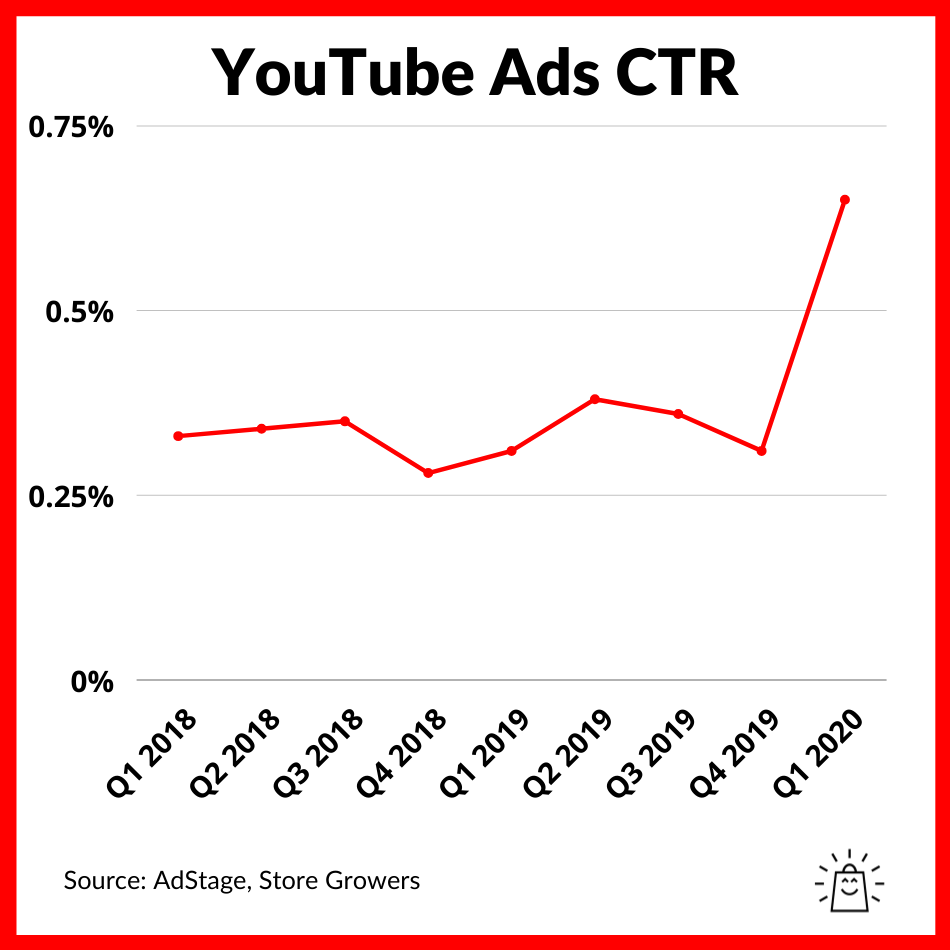

With many advertiser pulling spend from YouTube during Q1 of 2020, the ads that were there got a lot more attention, with CTR almost doubling!
CTR by Industry
Here is a breakdown of the YouTube Ads CPC rate by industry:
| Industry | CTR |
| Education | 0.56% |
| Fashion | 0.4% |
| Telecommunications | 0.33% |
| Baby & Child Care (CPG) | 0.07% |
| Healthcare & insurance | 0.45% |
| Toys | 1% |
| Household appliances | 0.045% |
| Entertainment | 0.43% |
| Restaurants | 0.04% |
| Government & advocacy | 0.07% |
| Health & beauty | 0.44% |
| Travel | 0.78% |
| B2B | 0.28% |
| Sports | 0.31% |
| Business & Finance | 0.38% |
| Science & technology | 0.31% |
| Automotive | 0.65% |
| Adult beverage | 0.28% |
| Food (CPG) | 0.31% |
| Electronics | 0.38% |
| Art | 0.36% |
| Home & Garden (CPG) | 0.31% |
| Gambling | 0.023% |
| Gaming | 0.9% |
| Retail | 0.84% |
Source: Strike Social 2017 benchmark report
How To Use These YouTube Ads Benchmarks
The goal of providing these benchmarks is to provide some perspective to what’s going on in your account.
Do you absolutely need to be at or higher than all of the averages presented here?
No. But if you’re too far off, you’re likely underperforming compared to other advertisers. That can mean paying 2-5x as much for a single view or click compared to the best advertisers.
You don’t become the best one overnight, but by noticing which of your ads or ad groups under or outperform your baseline or the benchmark, you can guide your optimization efforts!
Found something helpful for your campaigns? Let us know in the comments.


