For brands selling through retailer networks, the varying factors involved in end-consumer sales and overall brand awareness can sometimes feel difficult to control.
To optimize revenue, margins and brand image, ChannelAdvisor believes in cultivating and strengthening these four pillars of retailer performance:
- Assortment and availability
- Pricing and promotions
- Search and digital shelf
- Content and reviews
From our extensive experience working with brands across e-commerce and online retail, we already know that bolstering these pillars leads to growth and profitability for brands.
But how? And what does top-level performance in each of these core areas look like from a data analytics perspective? What does it all mean in relation to boosting sales, building retailer relationships and fostering brand engagement?
To find out, we decided to dissect the data behind established, successful products and brands. We examined a select set of best-selling products, and analyzed the actions taken in these four areas. In their efforts to connect, market and sell to consumers, brands must have an in-depth understanding of the dynamics involved in each pillar of retailer performance. This analysis was intended to help develop future strategies.
Methodology
We chose to focus on a category at the forefront of e-commerce adaptation: consumer electronics, specifically in the US. We chose SKUs that represented best sellers from best-in-class brands, and pulled data related to e-commerce activity over a 365-day period. We focused heavily on metrics that represented the four pillars: availability, prices, share of shelf and content.
Assortment & Availability
Top goals for brands in this area include:
- Maximizing negotiated assortment coverage within retailer networks (retailers selling product as agreed upon)
- Keeping products in stock and avoiding out-of-stock situations
- Winning the buy box on marketplaces
When we examined the data related to these three goals for the SKUs selected, we found the following results.

These results were particularly remarkable considering the supply chain challenges of the past year. However, these brands had everything under control. Of additional note: Observed out-of-stock issues were typically resolved within 24 hours, suggesting a strong proactive stance from the brands.
Price & Promotions
Monitoring pricing movements within a product line’s vertical is utterly critical for brands. This awareness reveals who is initiating pricing movements, who is following and contributing to further change and how significantly and suddenly those changes are occurring.
When we analyzed pricing movements for our top SKUs, we found price volatility was still a factor — but these brands avoided pricing wars and, overall, their products stayed close to MSRP.

Search & Digital Shelf
Capturing a competitive portion of the digital shelf is not easy. Brands want their products to stand out in retailer environments, maximizing their share of brand and generic searches.
The products we reviewed performed well in their competitive search presence.

This data shows that, for a list of relevant search terms, our best-in-class products were represented in an impressive 44% of the first five results. And, for category keywords (that do not contain the brand name), our product selection represented 25% of the 1st page of results.
Content
Finally, we examined content quality and optimization, including titles, images, videos, rich descriptions and more. For brands, content management goes far beyond the basics, involving retailer compliance with brand-set standards, customer sentiment expressed through reviews and feedback, overall content consistency and more.
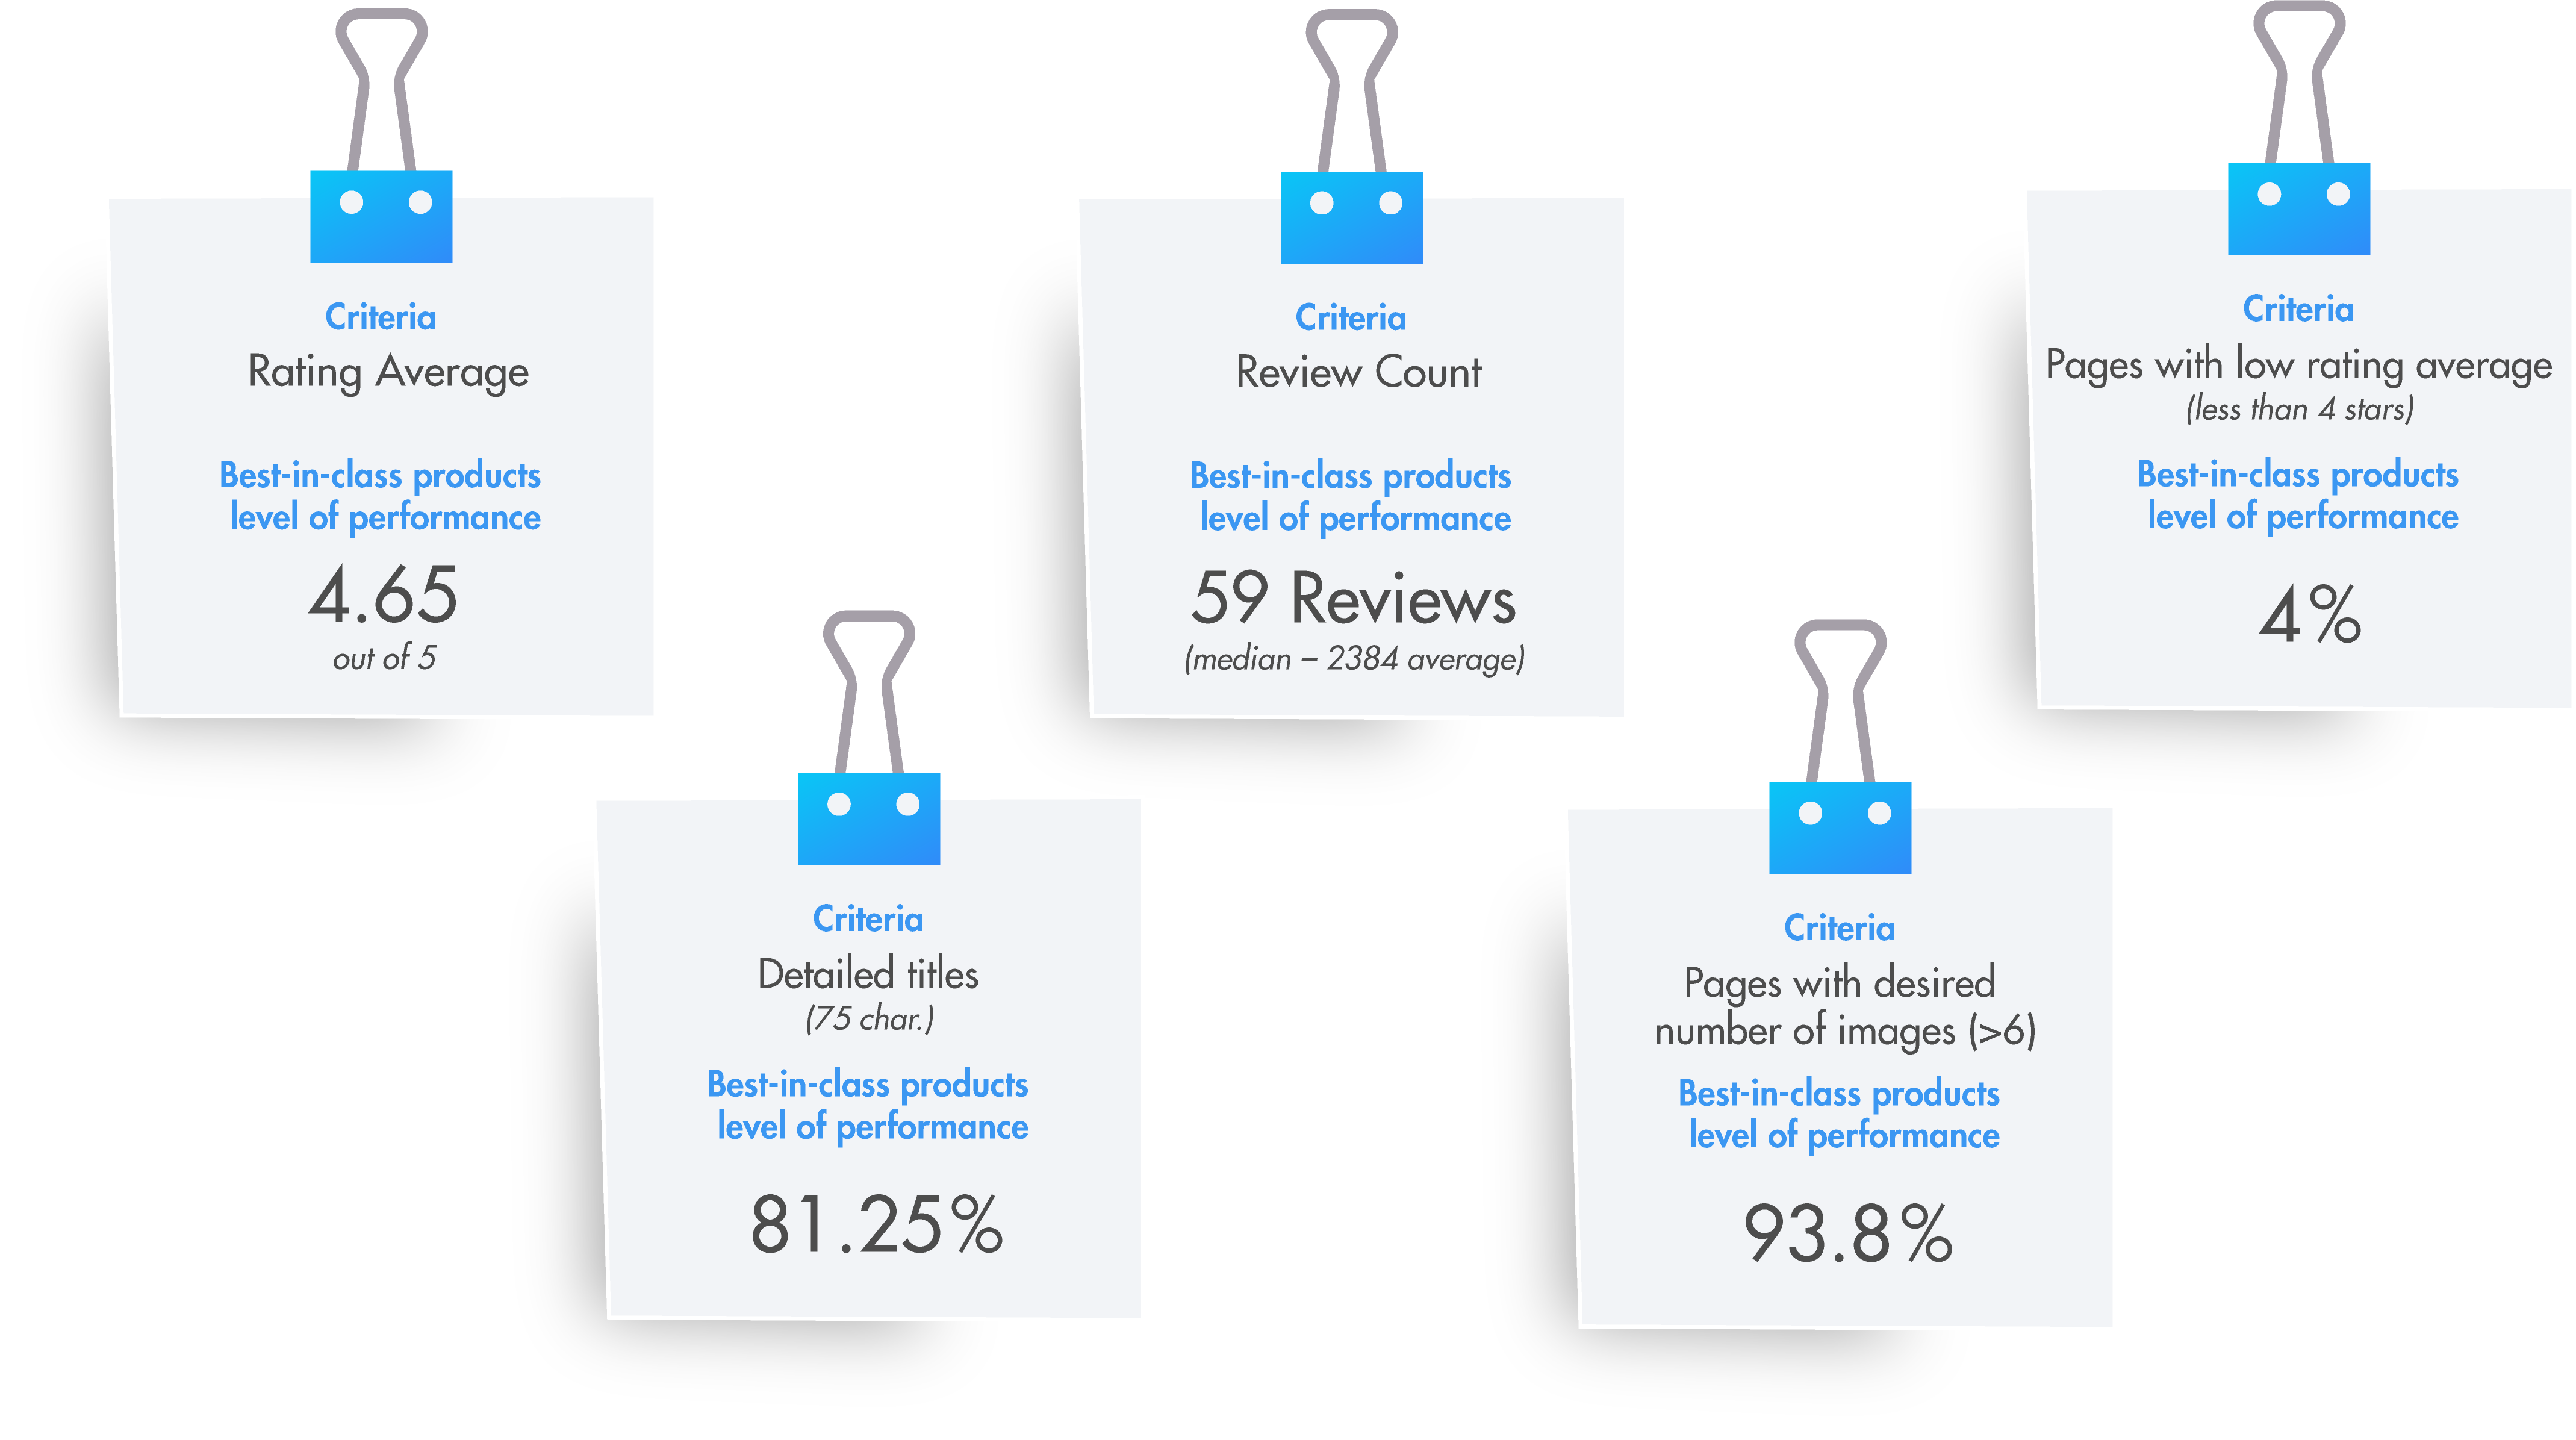
A short summary of what we examined is presented below.

In particular, the rating average, a healthy 4.65 out of 5, reaches a level that is likely to boost confidence in consumer purchases. With an industry standard minimum of 4 (out of 5), the higher the average, along with the higher the volume of reviews, the stronger the performance.
In addition, the difference between the review count median (59) and average (2384) indicates the reviews are concentrated in a small number of retailers — likely large ones. And other highly desirable characteristics of high-quality content are present, such as a high number of photos and detailed, descriptive titles.
Conclusion
This breakdown allowed us to put numbers behind the reasons why these SKUs and brands performed so well. To boost your products’ performance, we recommend starting by defining your business goals. Write them down to clarify and refine them. Then, look at them in context of the four pillars. Identify how you can begin measuring performance within each area. Then, continue to analyze performance over time, learn what works and fix problems as soon as they arise.
ChannelAdvisor Brand Analytics offers intelligent e-commerce insights for global brands. Our tools allow you to easily access vital data and boost productivity to achieve profitable growth and build a more powerful brand.
Interested in how your products would score in a similar analysis? Let’s find out! Get in touch with us through this form and we’ll follow up to walk you through a sample of how you score in each pillar of retailer performance.


